Nottingham Monthly Temperatures
Forecasting monthly temperatures from seasonal structure and long-term temporal patterns.
Selected model: DeterministicSeasonalTrendOLS
01 — Overview
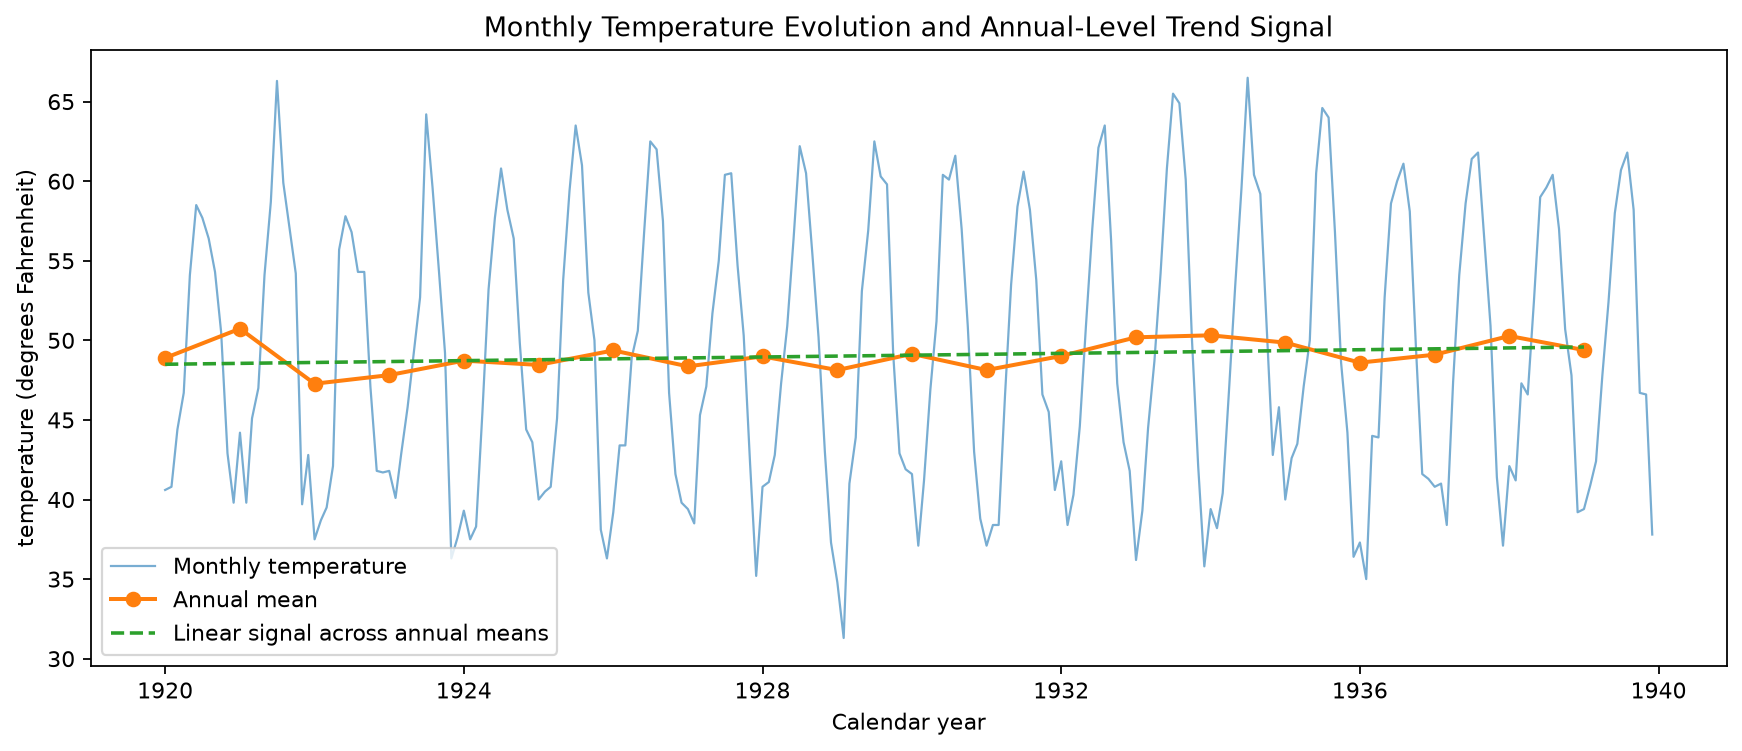
The classic datasets::nottem series contains 240 monthly average air-temperature observations from Nottingham Castle, covering January 1920 through December 1939. The target is temperature, measured in degrees Fahrenheit, and the original dataset contains no exogenous predictor series.
This study treats the data as a univariate forecasting problem rather than ordinary tabular regression. Its objective is to forecast the next 12 monthly temperatures while preserving temporal order and preventing future observations from influencing model development.
The first 228 observations, from 1920 through 1938, form the development history. The 12 months of 1939 are reserved for a one-time final evaluation after model selection is frozen. No missing months, duplicated periods, missing target values or non-finite temperatures required intervention, and the series is modeled on its original Fahrenheit scale.
02 — What the Data Revealed
Annual seasonality is the strongest systematic pattern in the series. July has the highest cross-year calendar-month mean and February the lowest, with a difference of approximately 22.71 °F between those monthly averages.
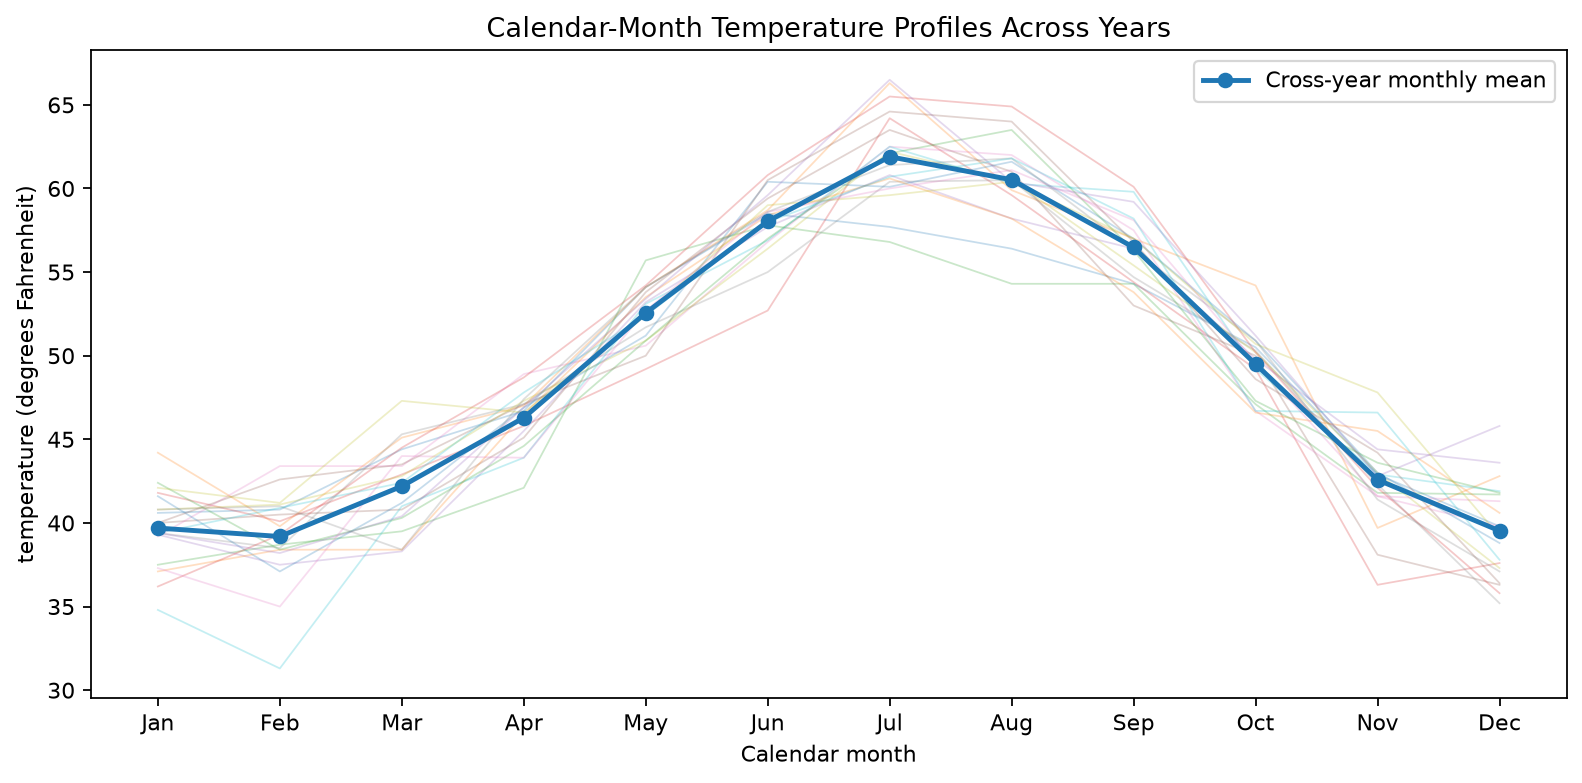
Exploratory STL decomposition also identifies strong seasonal structure, with seasonal strength of approximately 0.960, compared with trend strength of about 0.241. Autocorrelation at the 12-month lag is approximately 0.884 on the complete series, reinforcing the importance of the recurring annual cycle.
A modest long-run change in annual mean temperature is visible within the record, but these patterns are descriptive rather than causal. The study does not establish a climate mechanism or show that time itself causes the observed temperature changes.
03 — Modeling & Result
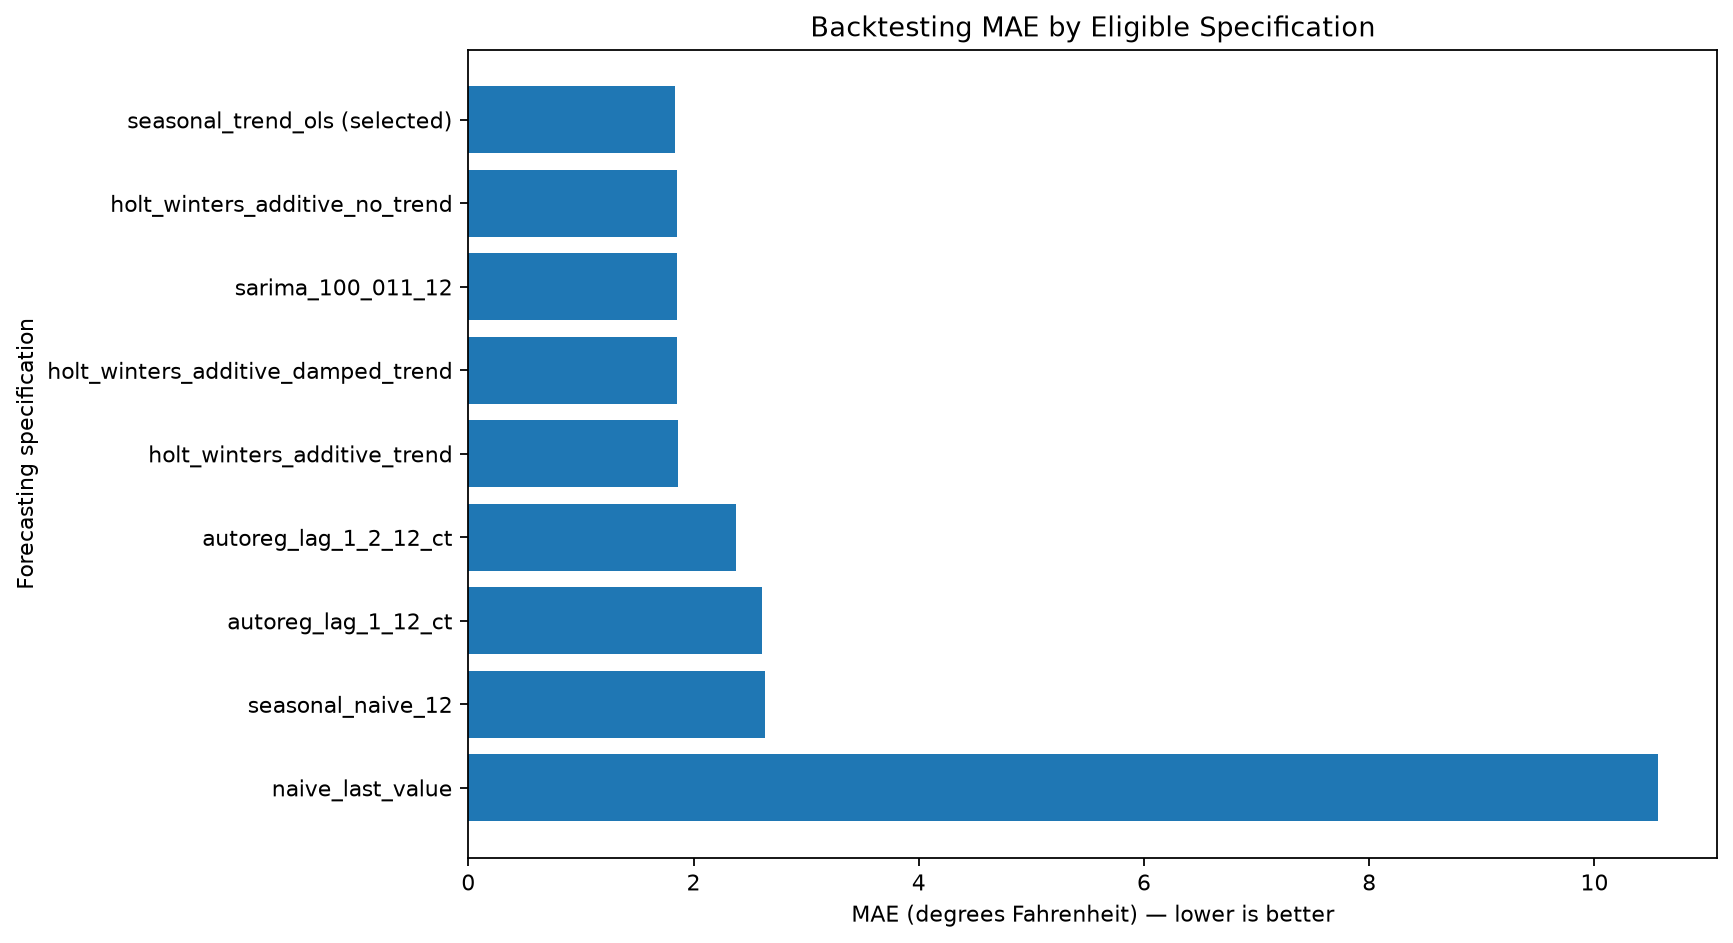
Model selection uses nine expanding-window backtesting folds. Each fold starts from the observations available at its forecast origin, fits the specification from scratch, and predicts the following 12 months without seeing those future targets. Across the complete backtesting schedule, each eligible specification produces 108 out-of-sample forecasts.
The frozen catalog contains two baselines and eight learned forecasting specifications spanning deterministic seasonal regression, exponential smoothing, autoregression and SARIMA. MAE is the primary selection metric, with RMSE and Seasonal MASE(12) used as secondary evidence.
seasonal_trend_ols, implemented as DeterministicSeasonalTrendOLS, achieved the lowest pooled backtesting MAE at 1.8394 °F, with RMSE of 2.3208 °F and Seasonal MASE(12) of 0.6570. Its MAE was approximately 30.3% lower than the 12-month seasonal-naive reference.
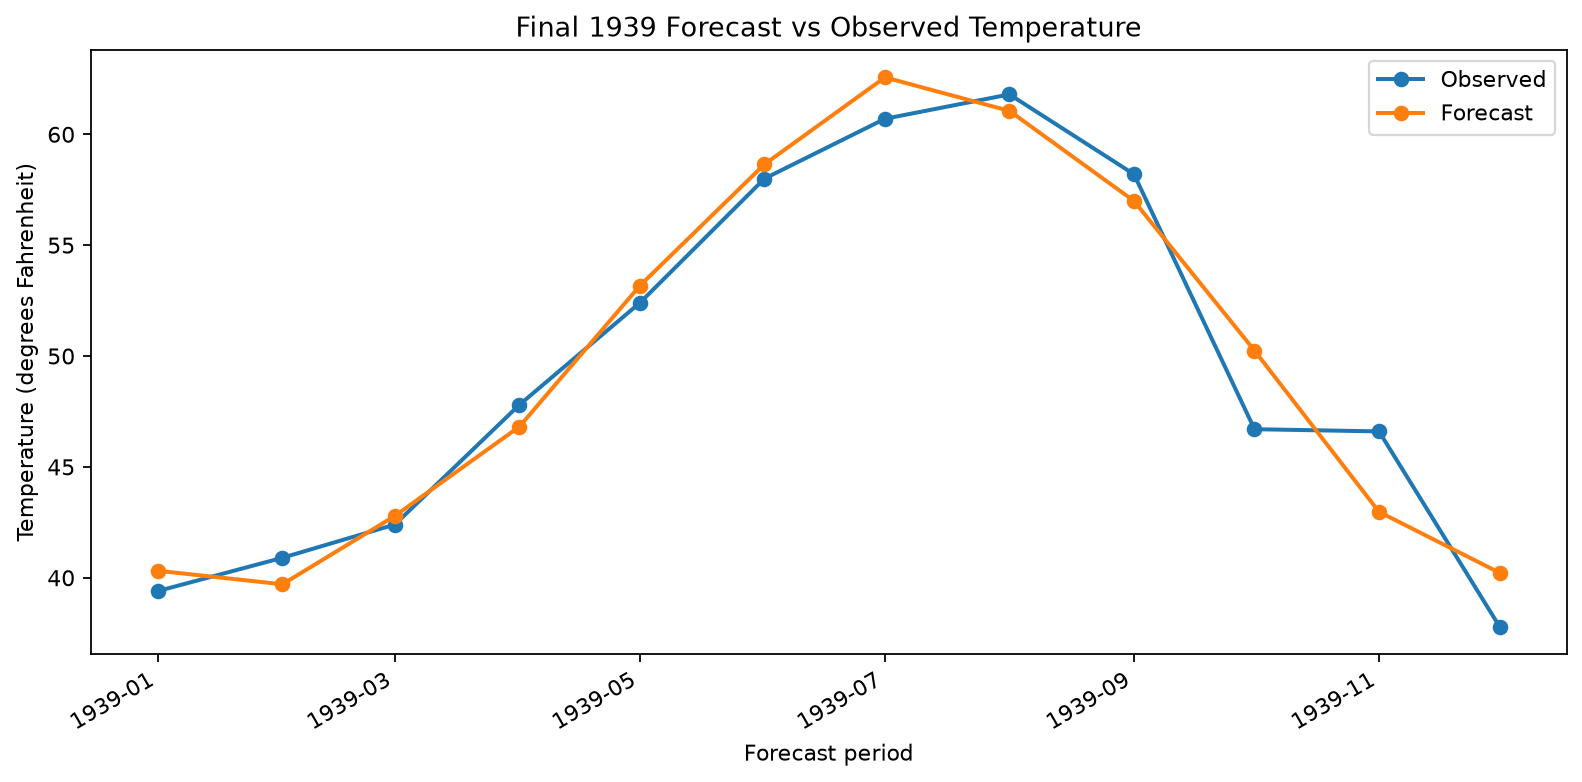
After the specification was frozen, it was fitted once on the complete 1920–1938 development history and evaluated once against the 12 withheld months of 1939.
Final 1939 MAE — 1.5266 °F
RMSE — 1.8600 °F
Seasonal MASE(12) — 0.5555
04 — Key Takeaways & Limitations
The results show that a compact deterministic model combining a linear time component with recurring calendar-month effects can capture a substantial share of the predictable structure in this strongly seasonal historical series. Its advantage over the seasonal-naive baseline also remains visible across the multi-origin backtesting protocol.
The result should nevertheless be interpreted within the experiment’s boundaries. The dataset contains only 240 observations and 20 annual cycles, while the final holdout represents a single calendar year. Notebook 01 also explored the complete 1920–1939 source retrospectively, so the 1939 holdout is sealed from model development and selection but is not exploration-blind in the strongest external-test sense.
No exogenous climate or atmospheric variables are available, and the study does not produce calibrated prediction intervals or establish causal climate effects. Performance under structural change, revised measurements or other distribution shifts remains untested, and the frozen model is not presented as an operational forecasting system.
This portfolio post presents only the main findings. The complete notebooks, code, forecasting contracts, methodological decisions and reproducibility evidence remain available in the study repository.