Concrete Compressive Strength
Predicting concrete compressive strength from mixture composition and curing age.
Selected model: HistGradientBoostingRegressor
01 — Overview
The UCI Concrete Compressive Strength dataset contains 1,030 observations described by eight numerical measurements covering concrete mixture composition and curing age. The target, Concrete compressive strength, is a continuous numerical value measured in MPa.
The seven mixture-component variables identify 427 distinct concrete mixtures. Many mixtures are measured at more than one curing age: 181 mixtures occur across multiple observations, accounting for 784 rows in the dataset.
The study asks whether the available mixture-composition and curing-age measurements contain useful predictive information for compressive strength under a reproducible row-level evaluation protocol.
The analysis is predictive rather than causal. Relationships between ingredients, curing age, and strength describe statistical patterns in the observed data and do not establish the effect of changing an individual component.
All 1,030 released observations and all eight validated predictors were preserved. No generic outlier removal, target transformation, or unsupported deduplication was applied.
A reproducible shuffled 70/15/15 row-level split produced 721 training rows, 154 validation rows, and a 155-row final-test partition. The final test was excluded from model selection and hyperparameter decisions.
Because the split is performed by row rather than grouping observations by concrete mixture, different curing-age observations from the same mixture can occur in different partitions. This distinction is important when interpreting the final performance.
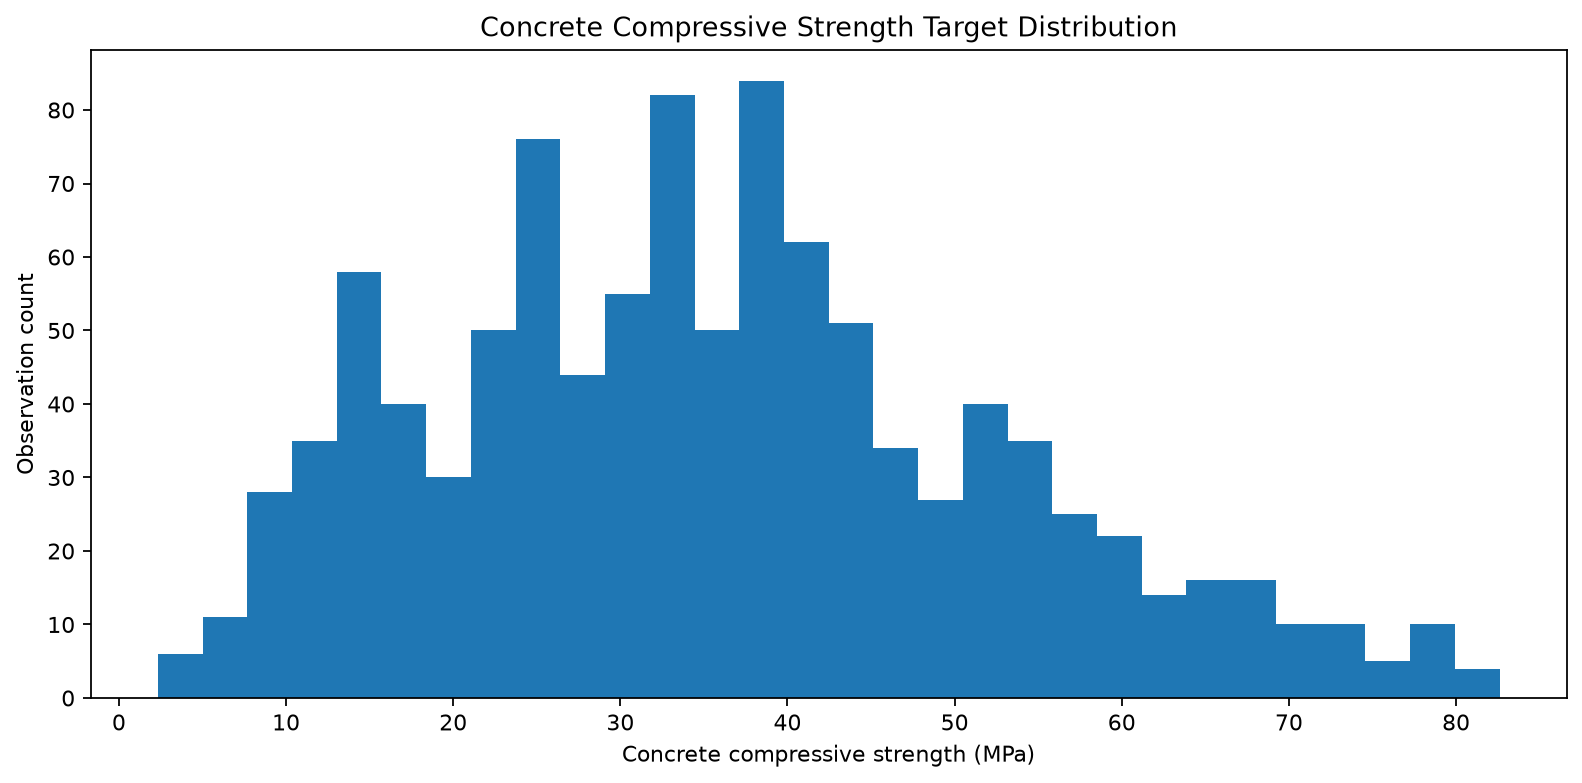
The target spans a broad range of observed compressive-strength values and remains on its original MPa scale throughout the study. Extreme values are treated as descriptive observations rather than automatic deletion candidates.
02 — What the Data Revealed
The exploratory analysis identified measurable relationships between several predictors and compressive strength.
Age and cement show prominent positive univariate associations with the target, superplasticizer also carries positive signal, while water shows a negative association.
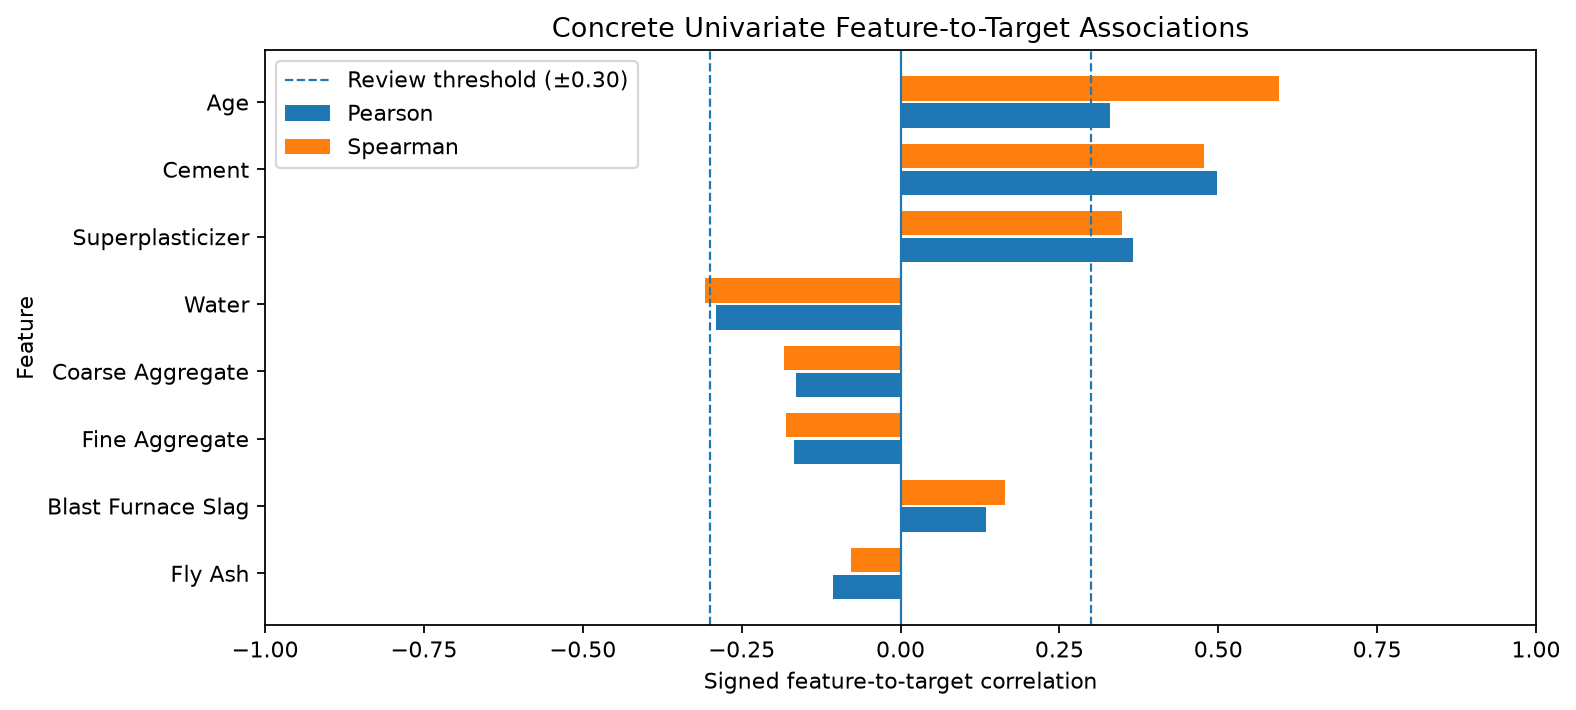
Age and cement show prominent positive univariate associations with compressive strength, while water shows a negative association. Pearson and Spearman estimates are used as descriptive signals rather than causal effects.
The numerical predictor space also contains substantial dependence between some mixture variables.
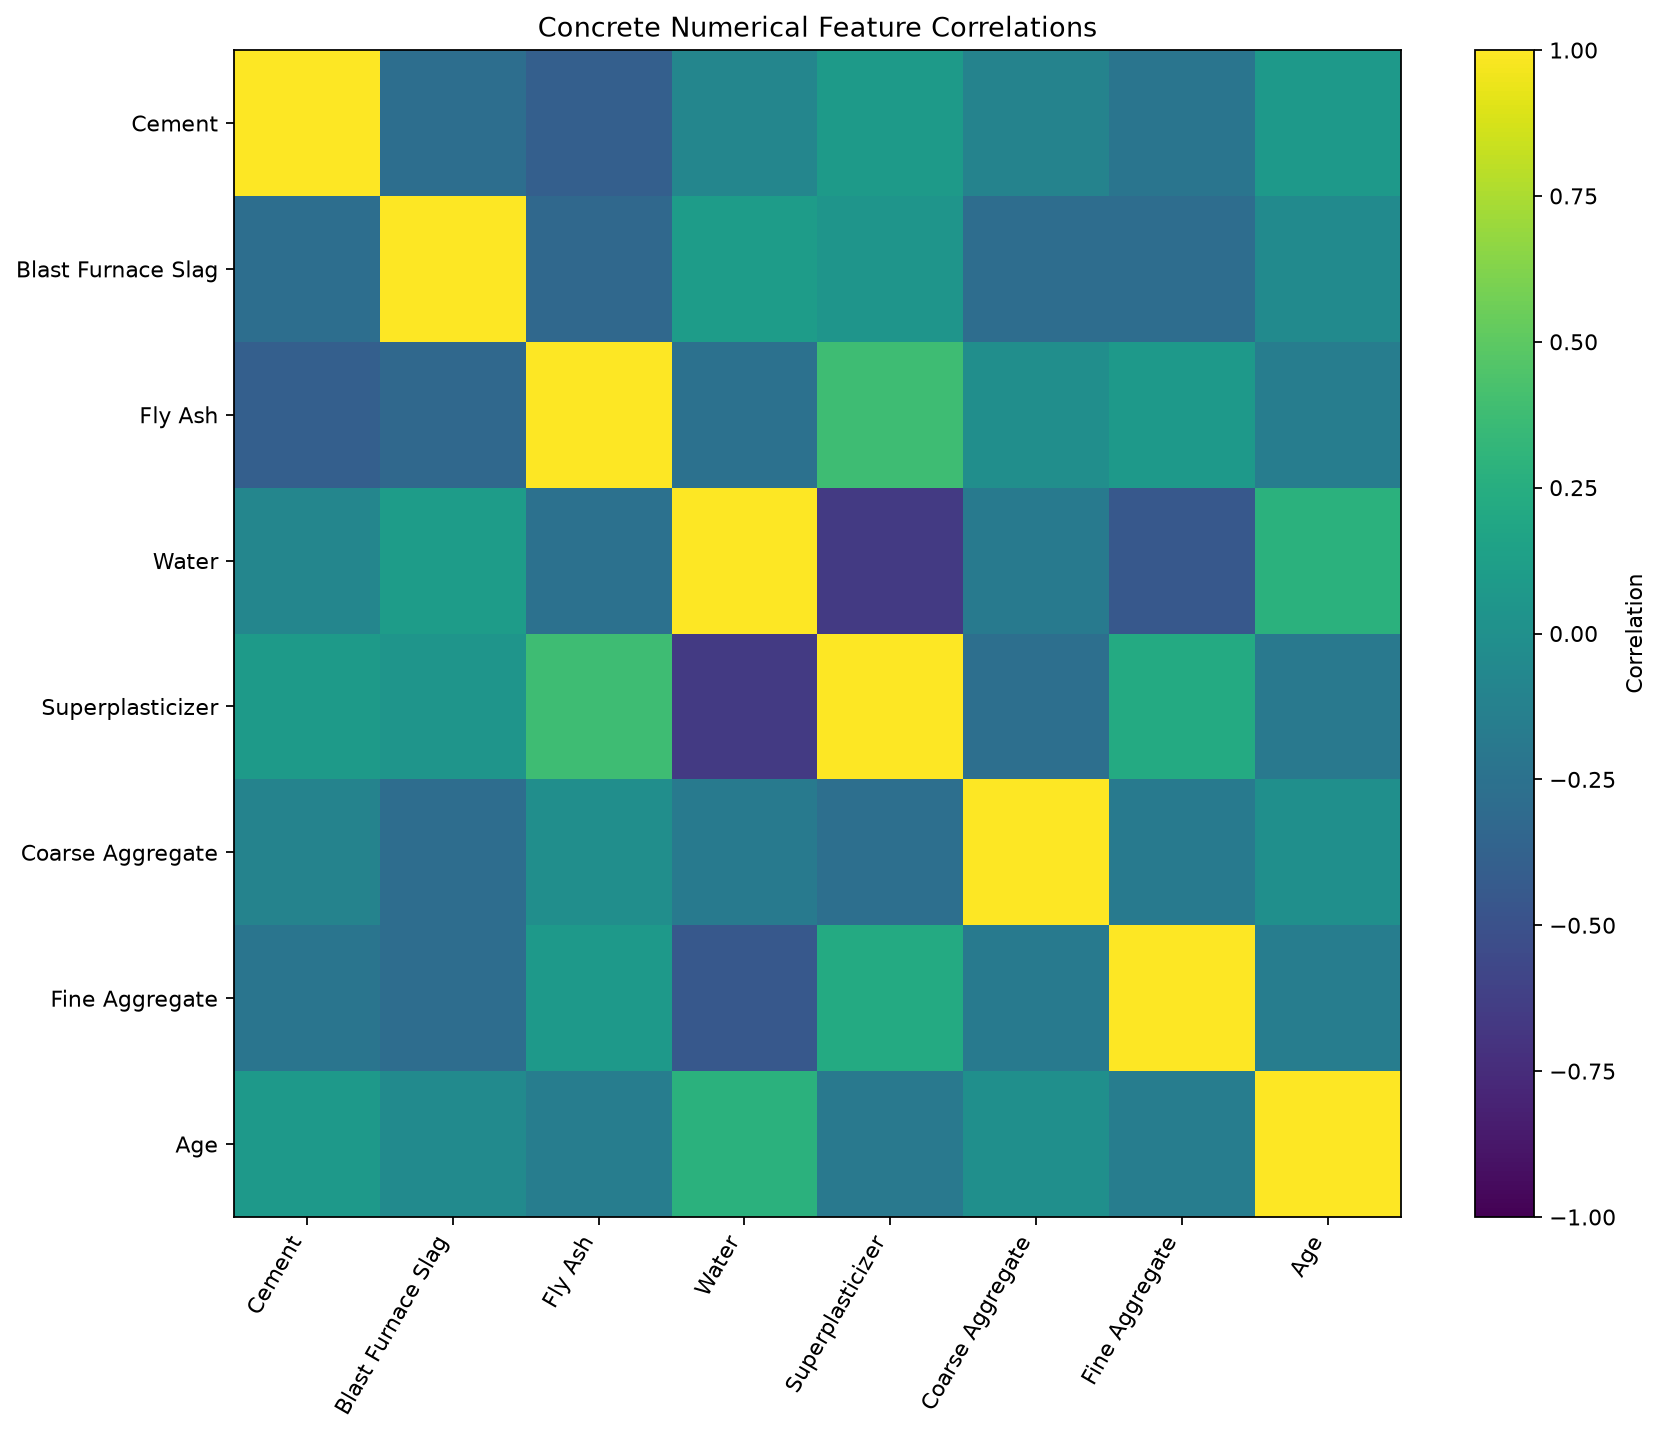
The correlation heatmap shows that several mixture components are statistically dependent. The study preserves this structure rather than automatically removing correlated predictors.
The exploratory analysis also finds evidence that a purely additive linear relationship may not capture all of the available predictive structure.
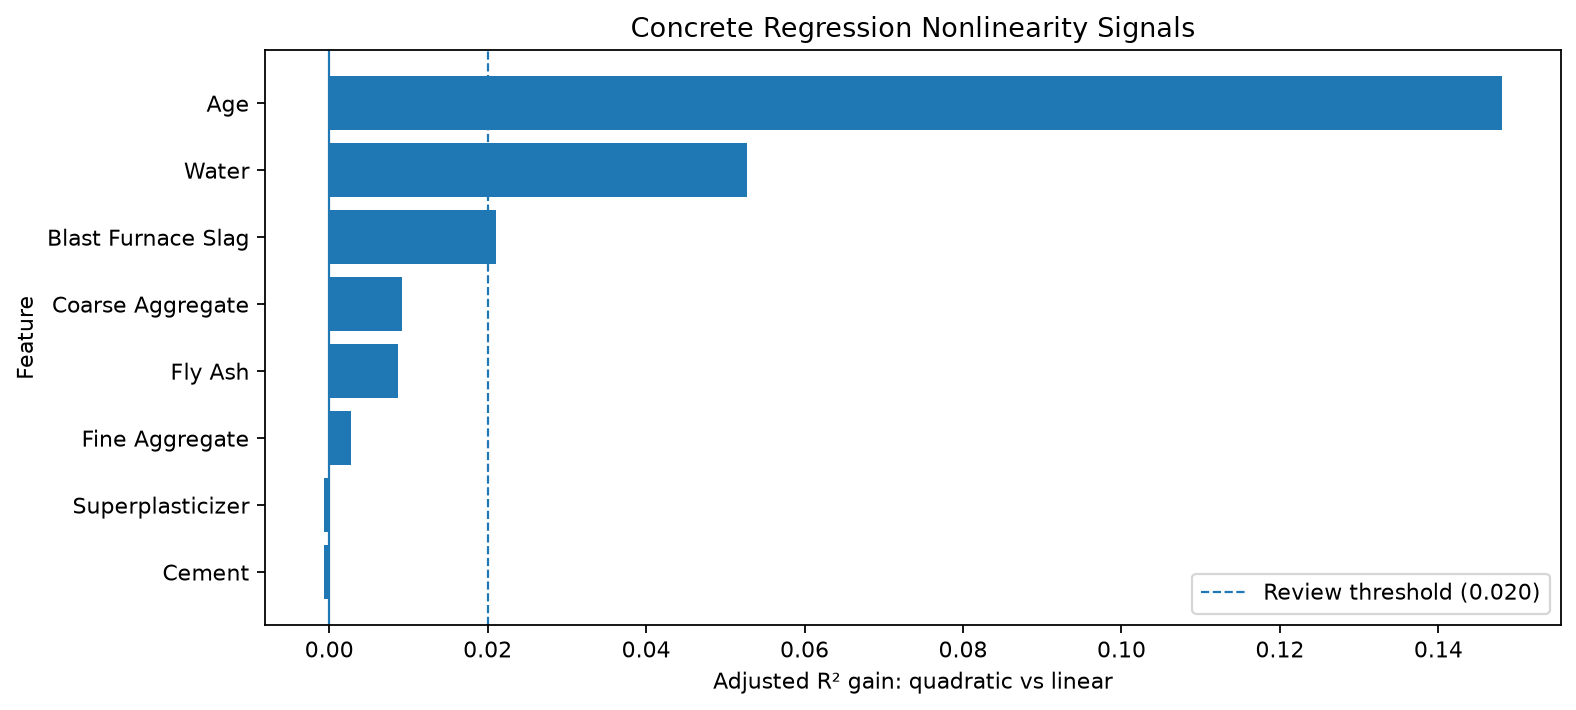
Age, water, and blast furnace slag cross the study’s exploratory nonlinearity-review threshold, motivating comparison with more flexible nonlinear model families.
Potential interaction structure is also visible among several pairs of predictors.
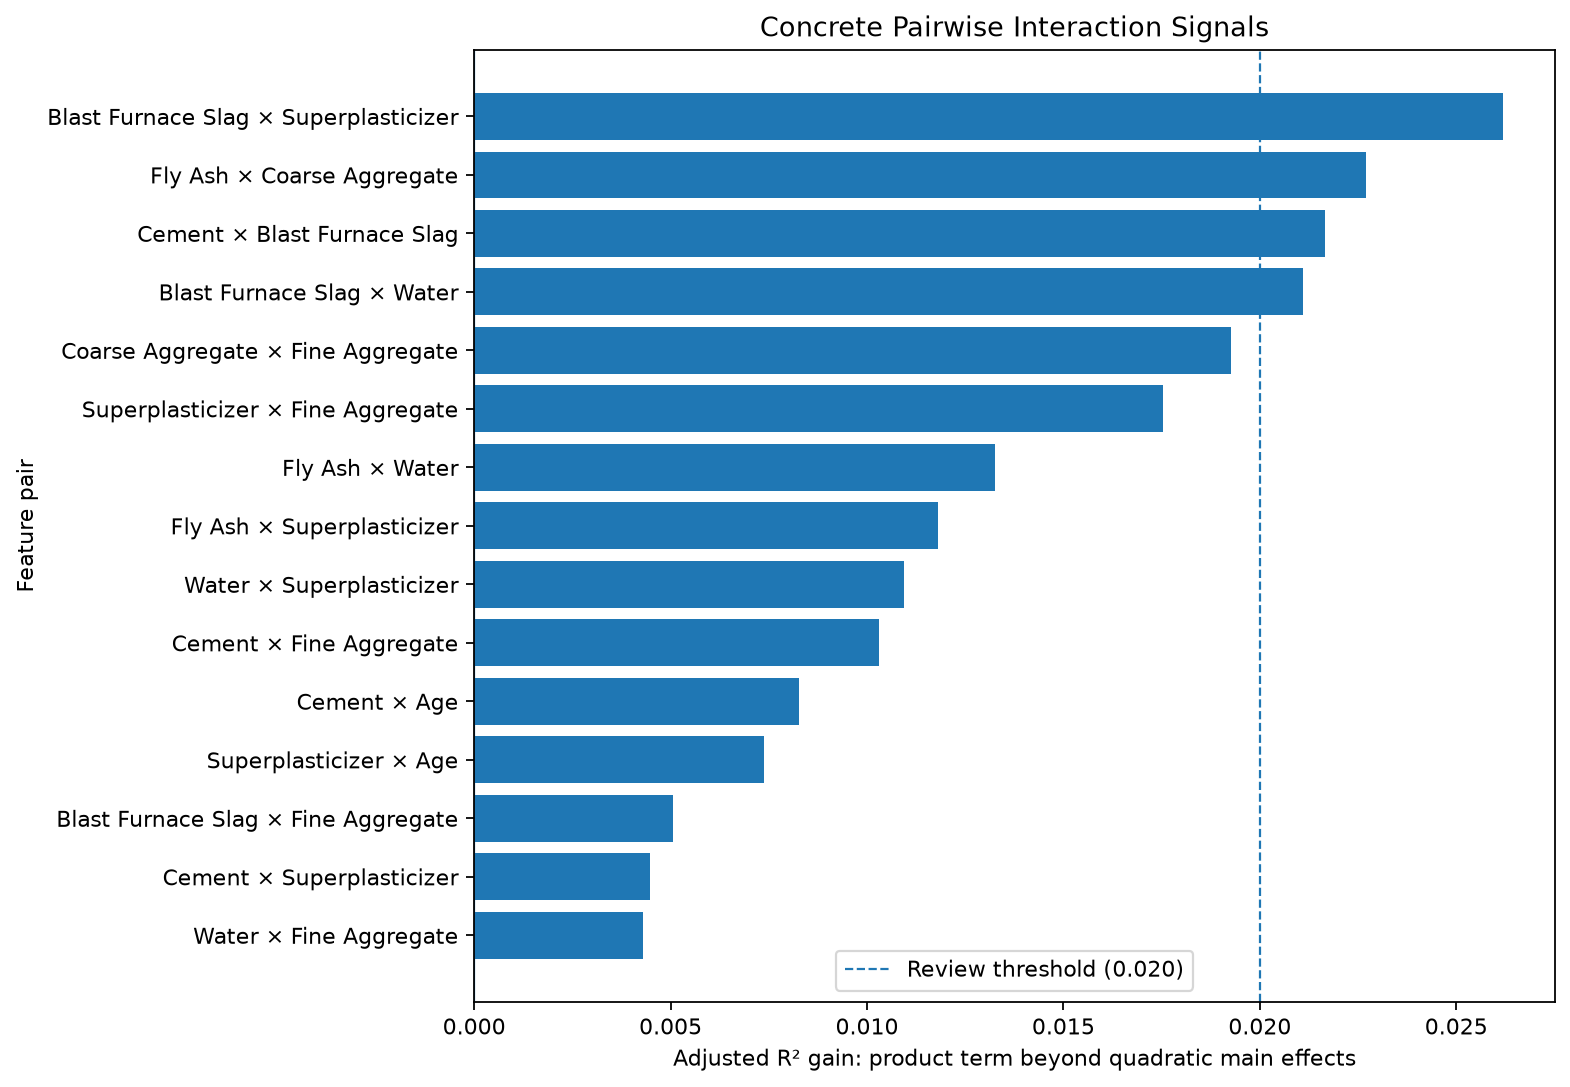
The strongest exploratory interaction signals include Blast Furnace Slag × Superplasticizer, Fly Ash × Coarse Aggregate, Cement × Blast Furnace Slag, and Blast Furnace Slag × Water. These diagnostics motivate interaction-aware models but are not themselves model-performance evidence.
These findings are exploratory and in-sample. They motivate model comparison but should not be interpreted as independent feature effects or as evidence that changing a particular ingredient would cause the observed difference in strength.
03 — Modeling & Result
The study compared a median Dummy baseline with Ridge, Decision Tree, Random Forest, and HistGradientBoosting regression.
The four trainable families evaluated 52 hyperparameter configurations using five-fold cross-validation restricted to the training partition.
MAE was the primary model-selection metric because it expresses prediction error directly in MPa.
HistGradientBoostingRegressor achieved the best frozen validation result:
- HistGradientBoostingRegressor — MAE 2.7417 MPa
- Random Forest — MAE 3.7689 MPa
- Decision Tree — MAE 4.2860 MPa
- Ridge — MAE 8.5944 MPa
- Dummy median baseline — MAE 12.8145 MPa
The selected model was more than the predefined 0.10 MPa practical-tie tolerance ahead of the next-best candidate, so no tie-break procedure was required.
After the model family, hyperparameters, feature policy, and preprocessing decisions were frozen, HistGradientBoostingRegressor was fitted once on the combined train + validation data — 875 observations — and evaluated on the 155-row final-test partition.
The aggregate final-test result was:
MAE — 2.5822 MPa
RMSE — 4.2104 MPa
R² — 0.9387
Median Absolute Error — 1.6363 MPa
Across the complete final-test sample, predictions therefore differ from observed compressive strength by approximately 2.58 MPa on average in absolute terms.
Evaluation scope: seen and unseen mixtures
The aggregate result requires an important qualification.
Because the split is row-level, a held-out observation may belong to a concrete mixture already represented during fitting at another curing age.
Of the 155 final-test observations:
- 116 rows — 74.84% — belong to mixtures already represented in train + validation;
- 39 rows — 25.16% — belong to mixture compositions not represented during fitting.
Their results differ materially:
| Evaluation subset | Rows | MAE | RMSE | R² |
|---|---|---|---|---|
| Mixture seen during fitting | 116 | 2.1978 MPa | 2.9552 MPa | 0.9699 |
| Mixture unseen during fitting | 39 | 3.7255 MPa | 6.6694 MPa | 0.8416 |
| Complete final test | 155 | 2.5822 MPa | 4.2104 MPa | 0.9387 |
The headline final-test metrics are therefore dominated by observations whose mixture composition was already represented during fitting.
The unseen-mixture subset is also small, containing only 39 observations. Its metrics provide useful diagnostic evidence, but they are not sufficient to establish robust generalization to genuinely new concrete mixture designs.
04 — Key Takeaways & Limitations
The study demonstrates that the available mixture-composition and curing-age measurements contain strong predictive information for concrete compressive strength under the executed row-level evaluation protocol.
The exploratory evidence helps explain why nonlinear models were worth testing: the data exhibit predictor dependence, measurable nonlinearity, and interaction signals. Consistent with that hypothesis, HistGradientBoosting substantially outperformed the additive linear Ridge benchmark during frozen validation.
The final-test MAE of 2.5822 MPa is broadly consistent with the validation result, but its interpretation must respect the structure of the dataset.
Most final-test observations belong to mixture compositions already represented during fitting. For these observations, MAE is approximately 2.20 MPa. For the 39 observations belonging to unseen mixture compositions, MAE increases to approximately 3.73 MPa.
The study therefore supports predictive performance within the observed row-level design, particularly for mixture compositions represented during fitting.
It does not establish equivalent performance for genuinely new concrete mixture designs. A stronger claim of that kind would require a separate grouped evaluation — for example, splitting by mixture composition — together with a new untouched holdout.
Additional limitations remain:
- the evaluation is based on a shuffled random snapshot rather than prospective or external validation;
- the unseen-mixture test subset contains only 39 observations;
- external representativeness across different materials, laboratories, testing standards, and environments has not been established;
- the study does not produce individual prediction-uncertainty intervals;
- measurement error in the source variables is not modeled;
- no causal effect of changing mixture components or curing age is estimated;
- operational feature availability, monitoring, drift handling, and production validity remain unconfirmed.
The model should therefore be understood as a reproducible predictive study rather than a production-ready engineering strength estimator.
This portfolio post presents the main scientific findings and their current scope. The complete notebooks, code, methodological decisions, figures, model-selection evidence, reproducibility artifacts, and detailed diagnostics remain available in the study repository.