Dry Bean
Classifying seven dry bean varieties from numerical morphology measurements.
Selected model: HistGradientBoostingClassifier
01 — Overview
The Dry Bean dataset contains 13,611 individual bean grains represented by 16 numerical morphology measurements derived from image analysis. The target, Class, identifies one of seven nominal varieties: SEKER, BARBUNYA, BOMBAY, CALI, DERMASON, HOROZ or SIRA.
The study investigates how effectively these measurements can distinguish held-out bean samples under a frozen evaluation protocol. The model operates on numerical features that have already been extracted from images; it does not classify raw photographs. The objective is predictive rather than causal.
All source observations and all 16 candidate features were preserved. No generic imputation, automatic outlier deletion or unsupported deduplication was applied.
The data was divided with a reproducible stratified 70/15/15 two-stage split: seed 42 separated the training partition from the temporary holdout, and seed 43 separated that holdout into validation and final-test partitions. This produced 9,527 training rows, 2,042 validation rows and 2,042 final-test rows.
The split was frozen before distribution-aware or target-aware exploratory analysis. Development exploration was then restricted to the training partition.
The seven classes have unequal support. DERMASON is the most frequent class and BOMBAY the least frequent, with a majority/minority support ratio of approximately 6.8 in the training data.
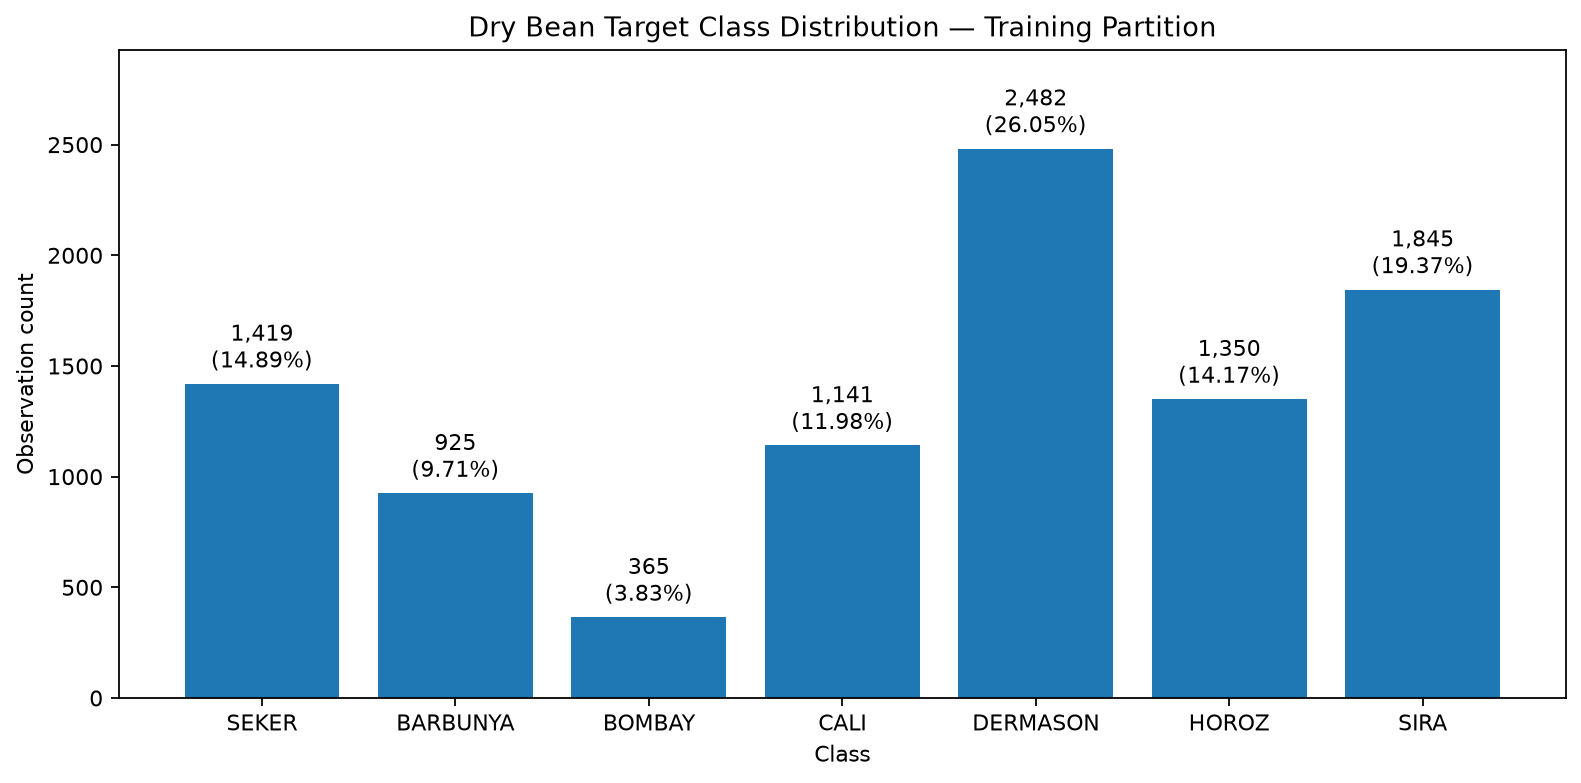
Because support differs across the seven varieties, overall accuracy alone is not sufficient to characterize predictive performance. Macro F1 is therefore used as the primary model-selection metric so that every class contributes equally to the result.
02 — What the Data Revealed
Target-aware exploratory analysis is performed on the training partition only, containing 9,527 bean observations.
Several morphology measurements show substantial association with Class. Variables related to bean size and geometry — including Area, ConvexArea, EquivDiameter, Perimeter and the major and minor axis lengths — contain particularly strong univariate predictive signal.
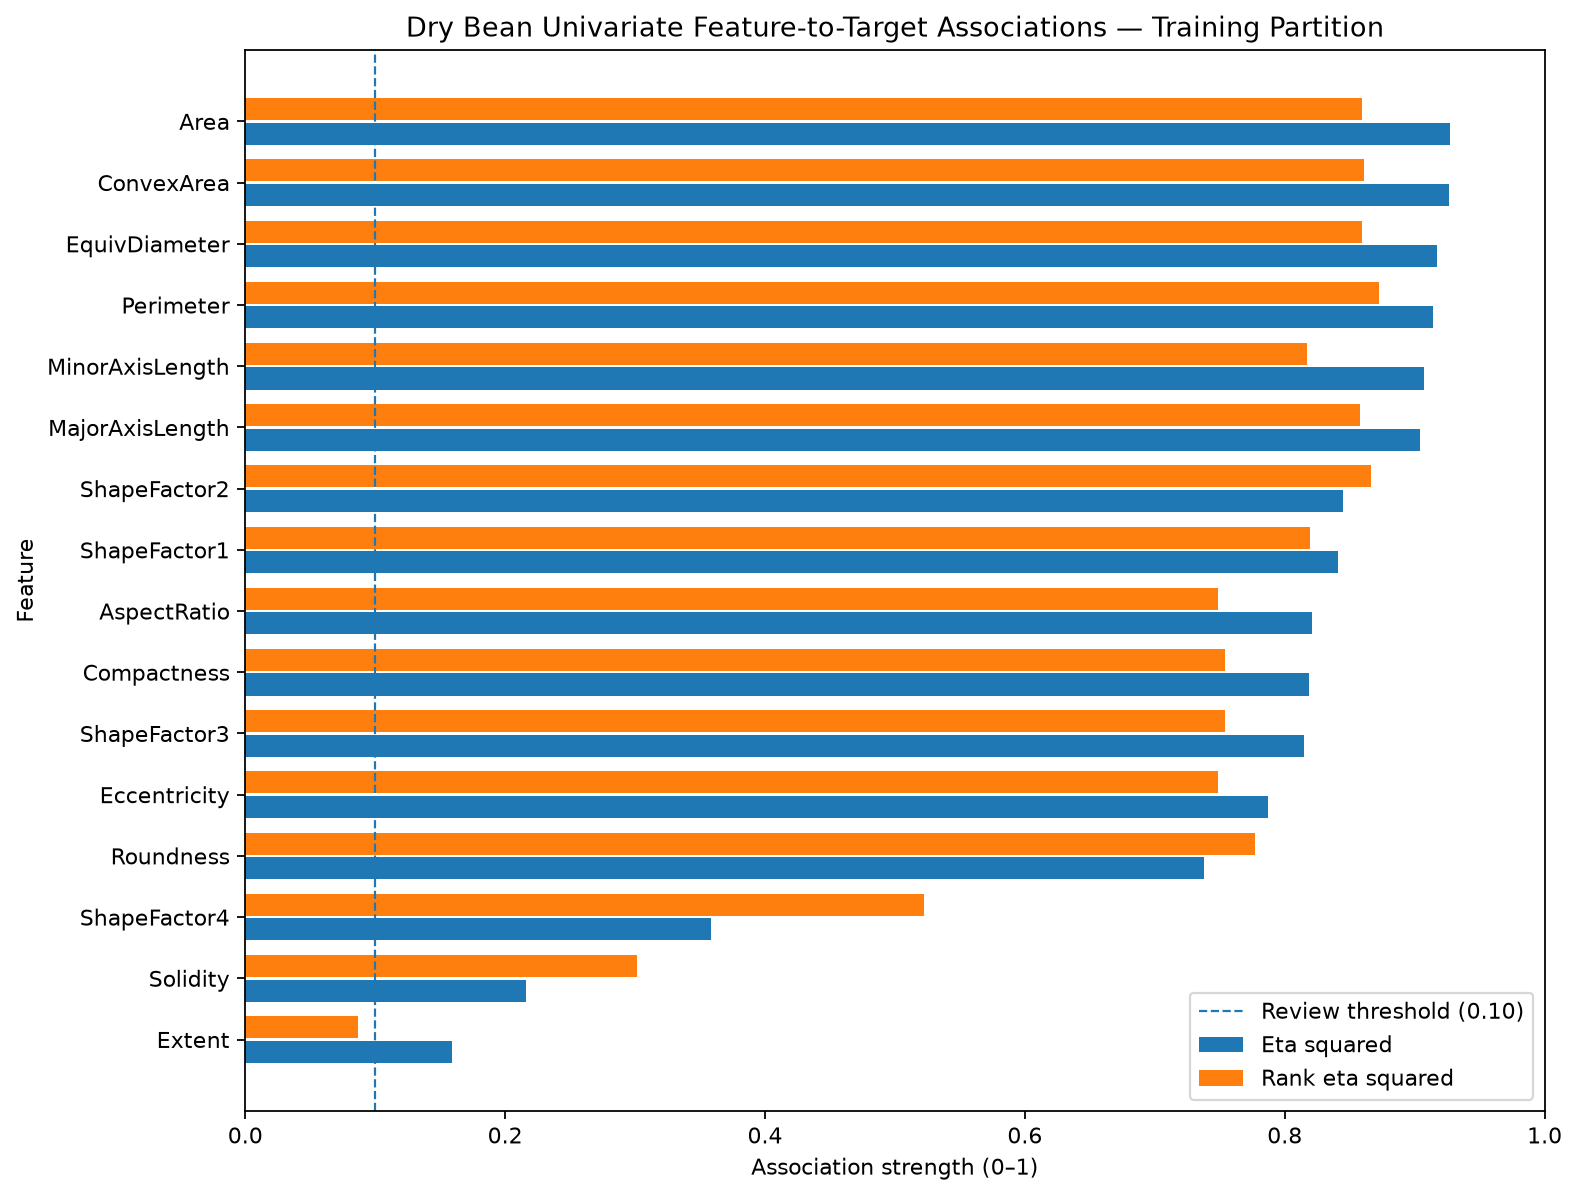
These relationships are exploratory evidence rather than causal effects. They show that the observed morphology contains information associated with variety, but they do not establish that an individual measurement independently determines the class.
The numerical feature space also contains substantial redundancy. Several measurements are strongly correlated or mathematically related.
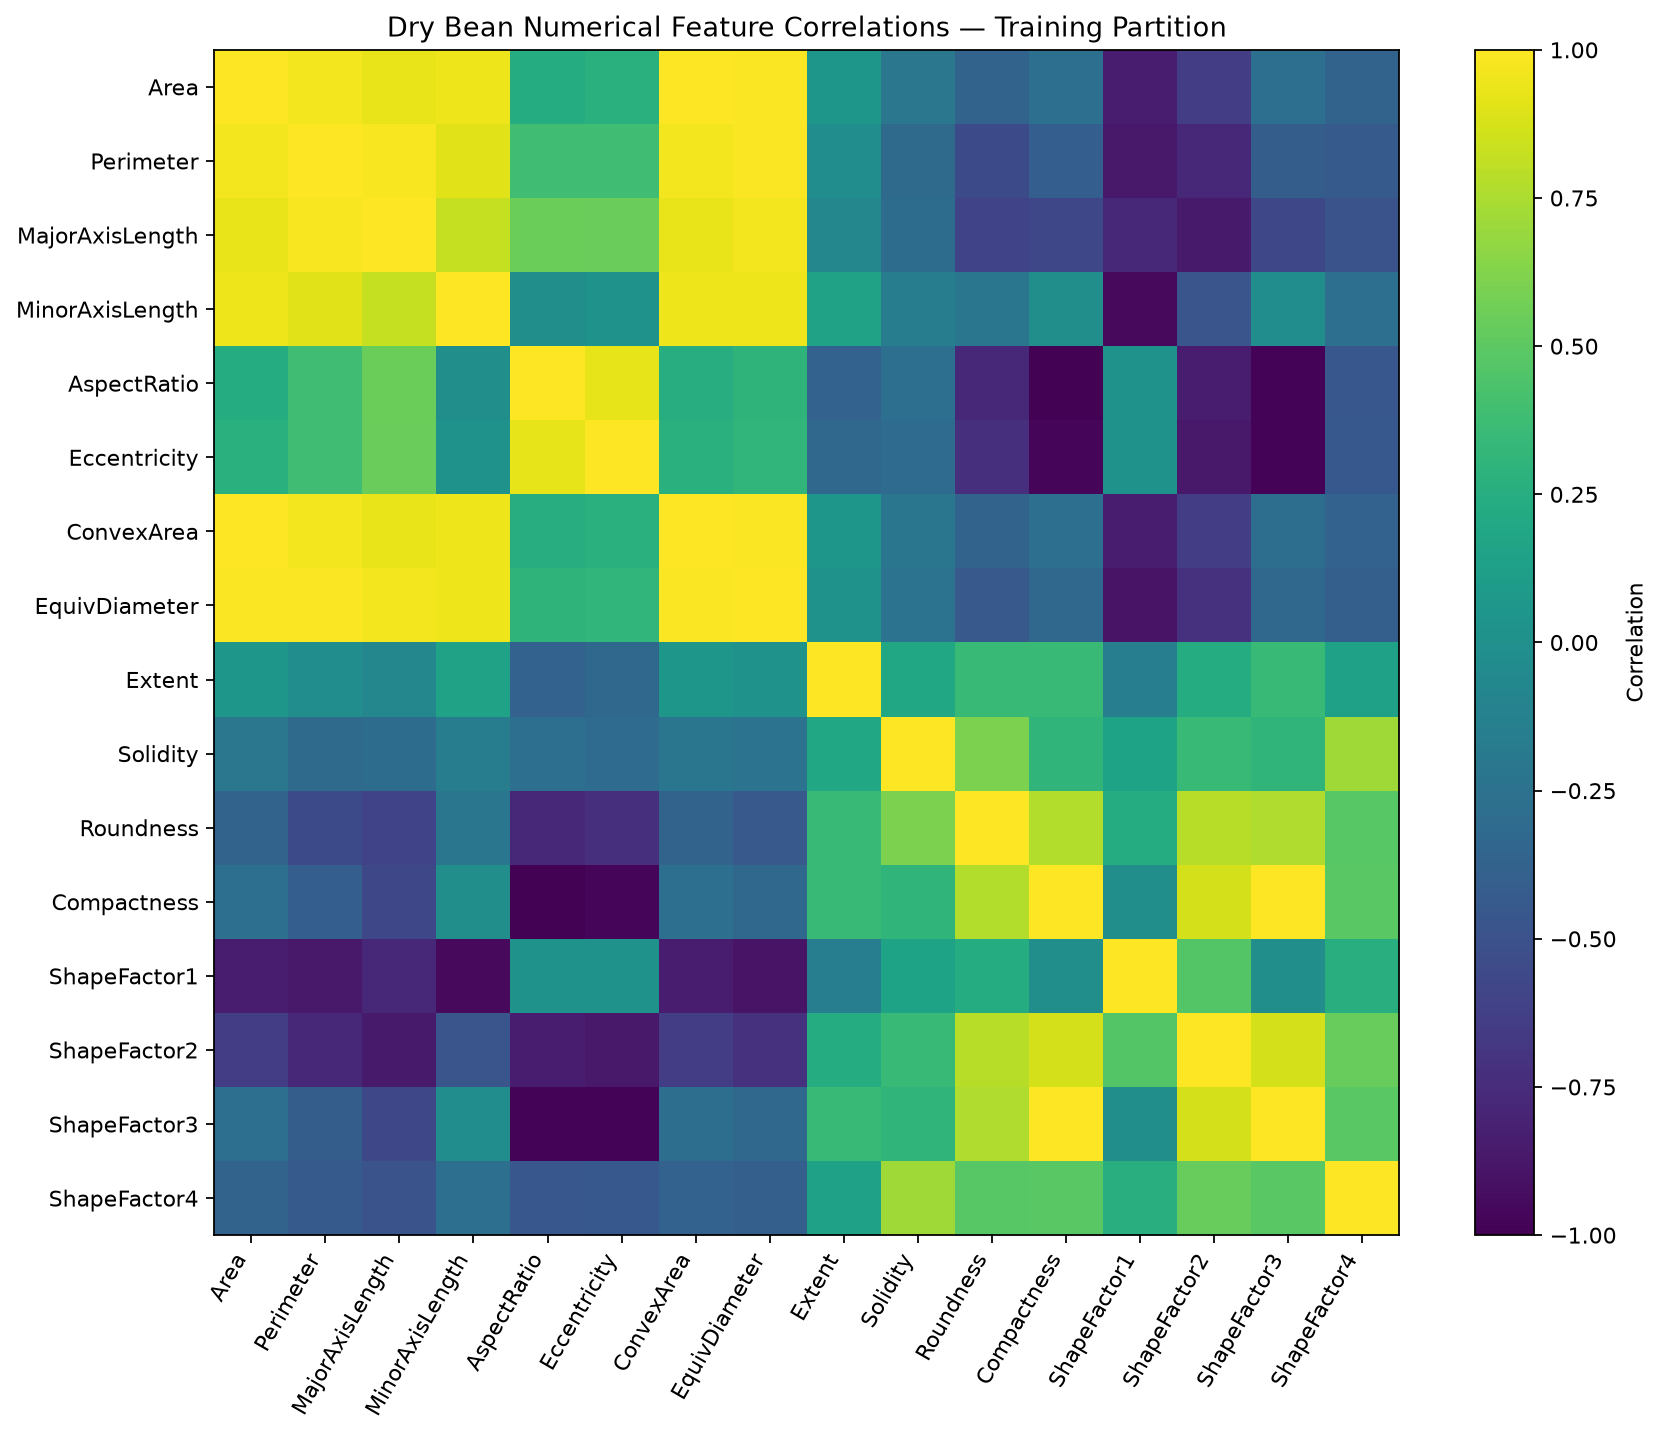
Nine derived dependencies are numerically confirmed:
AspectRatio, Eccentricity, EquivDiameter, Solidity, Roundness, Compactness, ShapeFactor1, ShapeFactor3 and ShapeFactor4.
ShapeFactor2 is treated separately because its audited source formula is not numerically confirmed at the configured tolerance. This does not imply that the feature itself is invalid.
A lower-dimensional exploratory projection provides a visual summary of how the seven varieties occupy the morphology space.
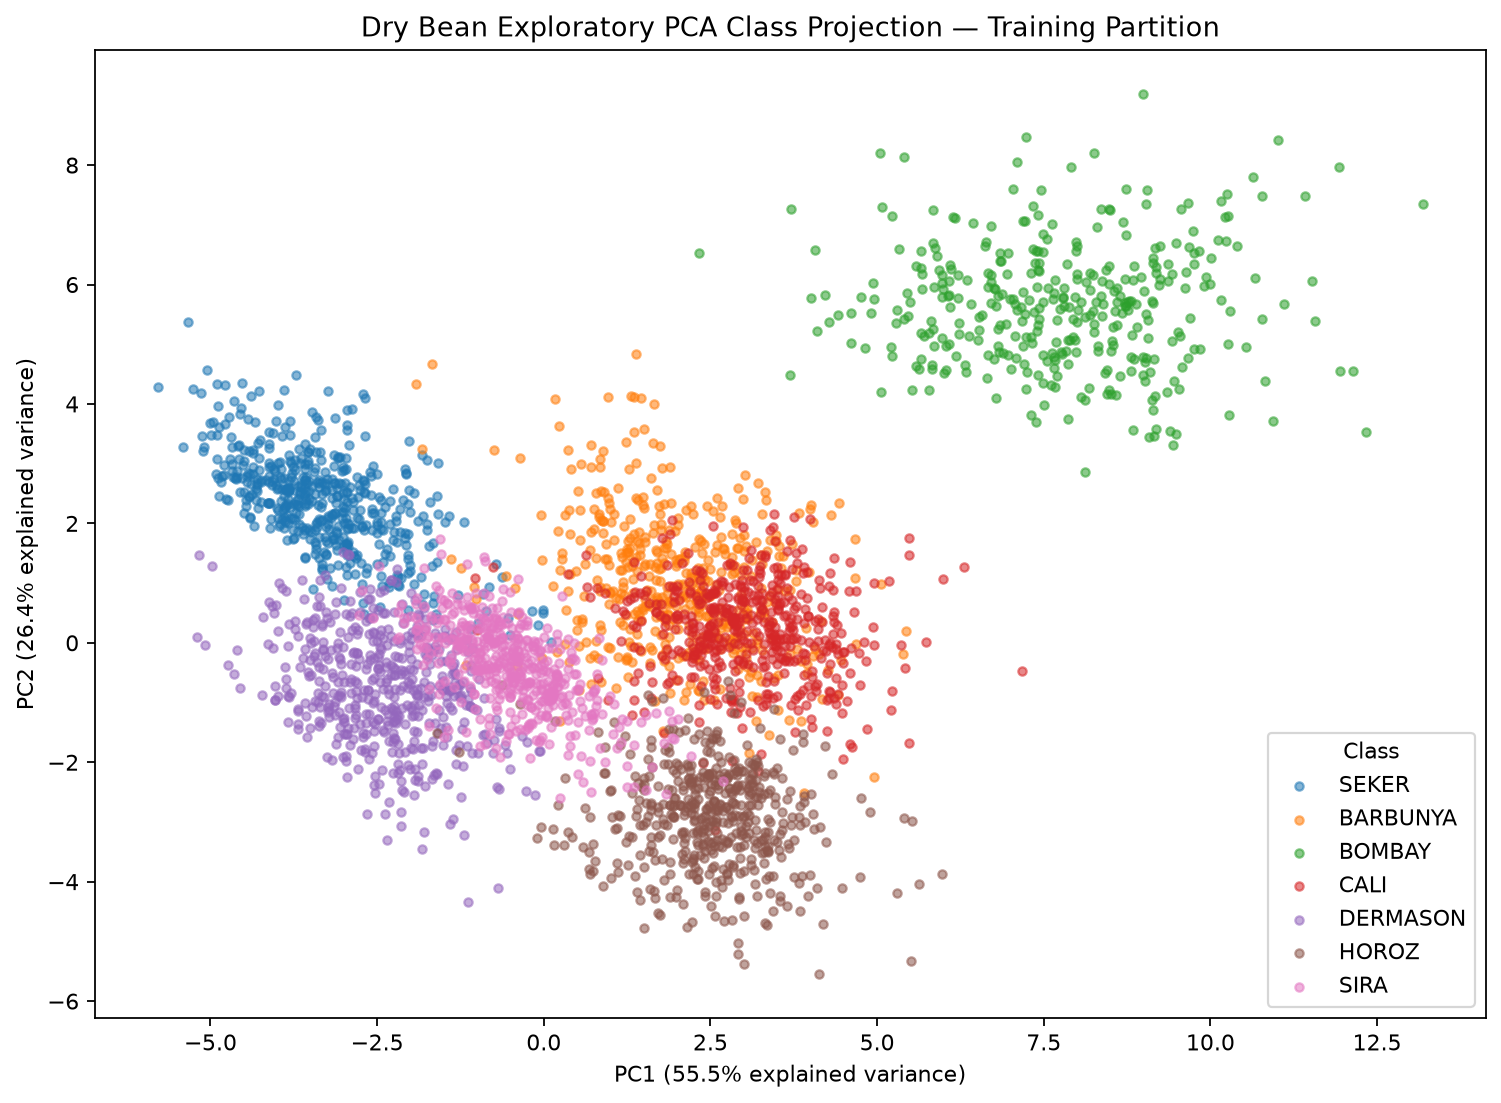
The PCA projection shows meaningful separation together with overlap among some classes. BOMBAY occupies a comparatively distinct region, while several other varieties overlap more strongly.
The PCA view is exploratory only. It is not itself a classifier and does not replace the complete 16-feature predictive representation used during modeling.
03 — Modeling & Result
The study compares a prior-only Dummy baseline with Logistic Regression, Decision Tree, Random Forest and HistGradientBoostingClassifier.
Candidate-family search uses five-fold stratified cross-validation restricted to the training partition.
HistGradientBoostingClassifier records the strongest mean CV Macro F1 at 0.937012, followed by Logistic Regression at 0.935031, Random Forest at 0.933343 and Decision Tree at 0.919904.
HistGradientBoostingClassifier and Logistic Regression form the CV-only shortlist and proceed to controlled feature-policy evaluation on the frozen validation partition.
The shortlisted models are evaluated under three feature policies:
- all 16 features;
- all features except
ShapeFactor2; - seven features after removing the nine confirmed derived features.
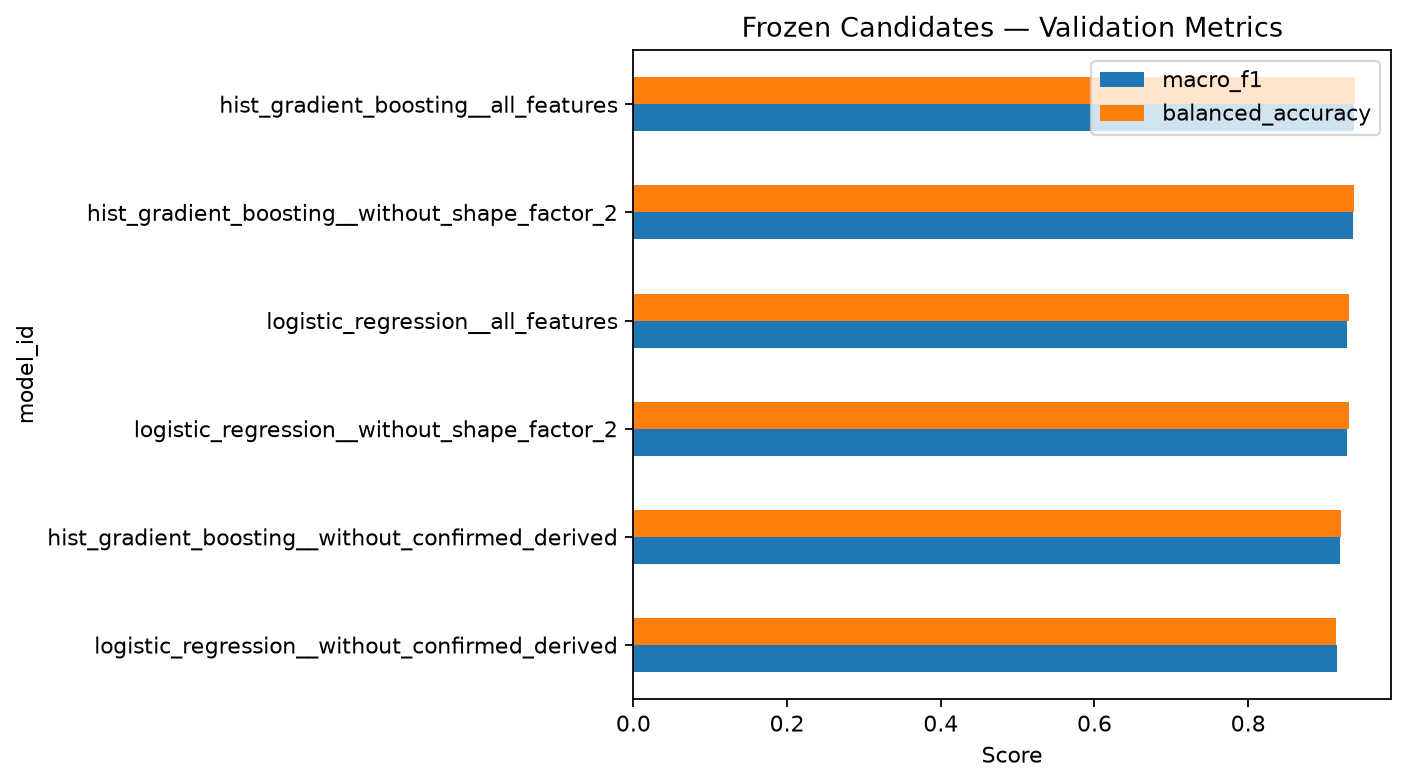
The two strongest HistGradientBoosting configurations form a predefined practical validation tie.
Their validation Macro F1 values are:
All features — 0.937881
Without ShapeFactor2 — 0.936677
The difference is approximately 0.001204, below the predefined practical-tie tolerance of 0.002.
The tie is therefore resolved by the first applicable predefined criterion, validation Balanced Accuracy:
All features — 0.939131
Without ShapeFactor2 — 0.938146
This selects hist_gradient_boosting__all_features as the final scientific configuration.
The feature-policy experiment also evaluates whether the full morphology representation should be retained.
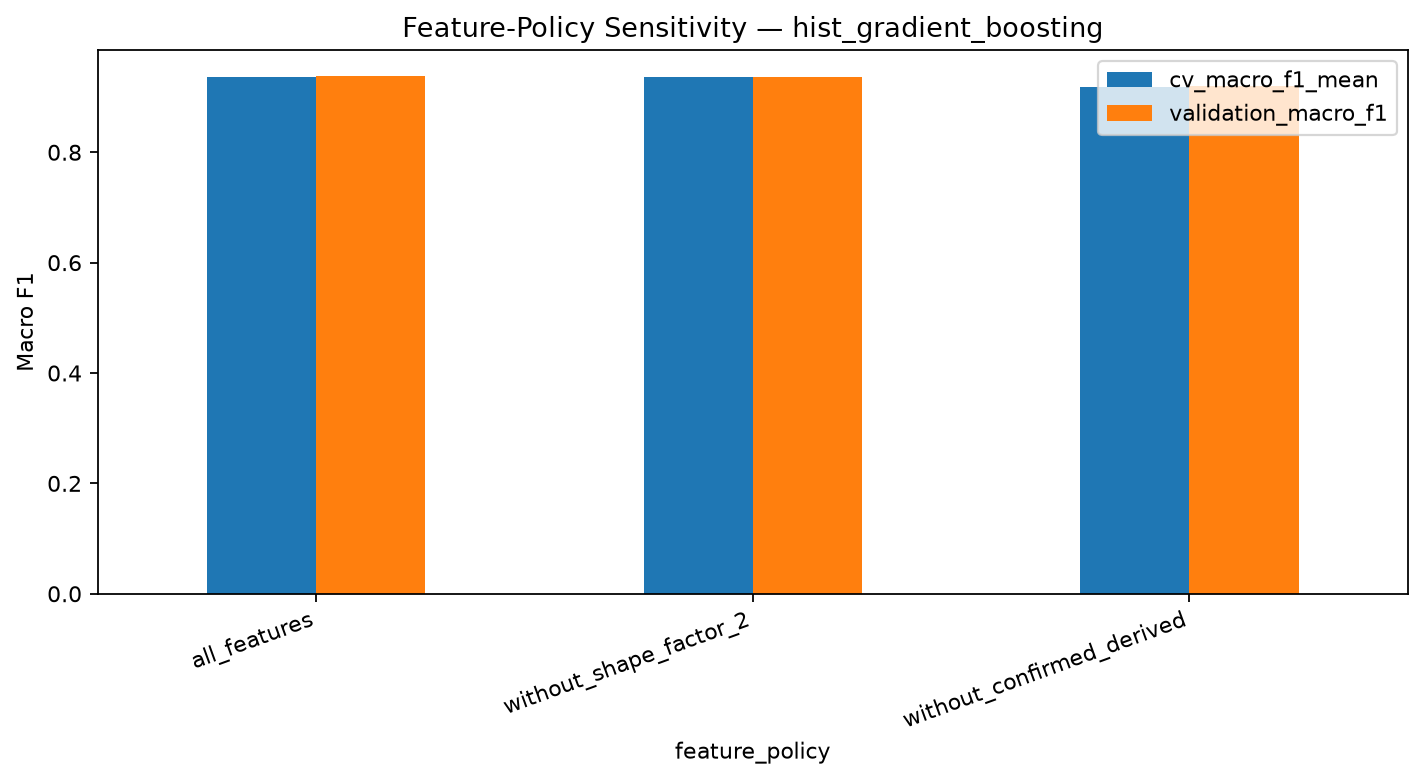
Removing only ShapeFactor2 changes validation Macro F1 by approximately -0.001204.
Removing the nine confirmed derived features reduces validation Macro F1 from approximately 0.937881 to 0.919956, a difference of approximately -0.017925.
The selected HistGradientBoostingClassifier therefore retains all 16 numerical features, with:
class_weight = Nonelearning_rate = 0.05max_iter = 250max_leaf_nodes = 15min_samples_leaf = 40l2_regularization = 0.0random_state = 42
No resampling is used.
After the model family, hyperparameters and feature policy are frozen, the selected classifier is fitted once on train + validation, totaling 11,569 observations, and evaluated on the final-test partition of 2,042 observations.
The final scientific results are:
Macro F1 — 0.941835
Balanced Accuracy — 0.939897
Accuracy — 0.932419
Log Loss — 0.181024
Validation and final-test results remain close across the main evaluation metrics.
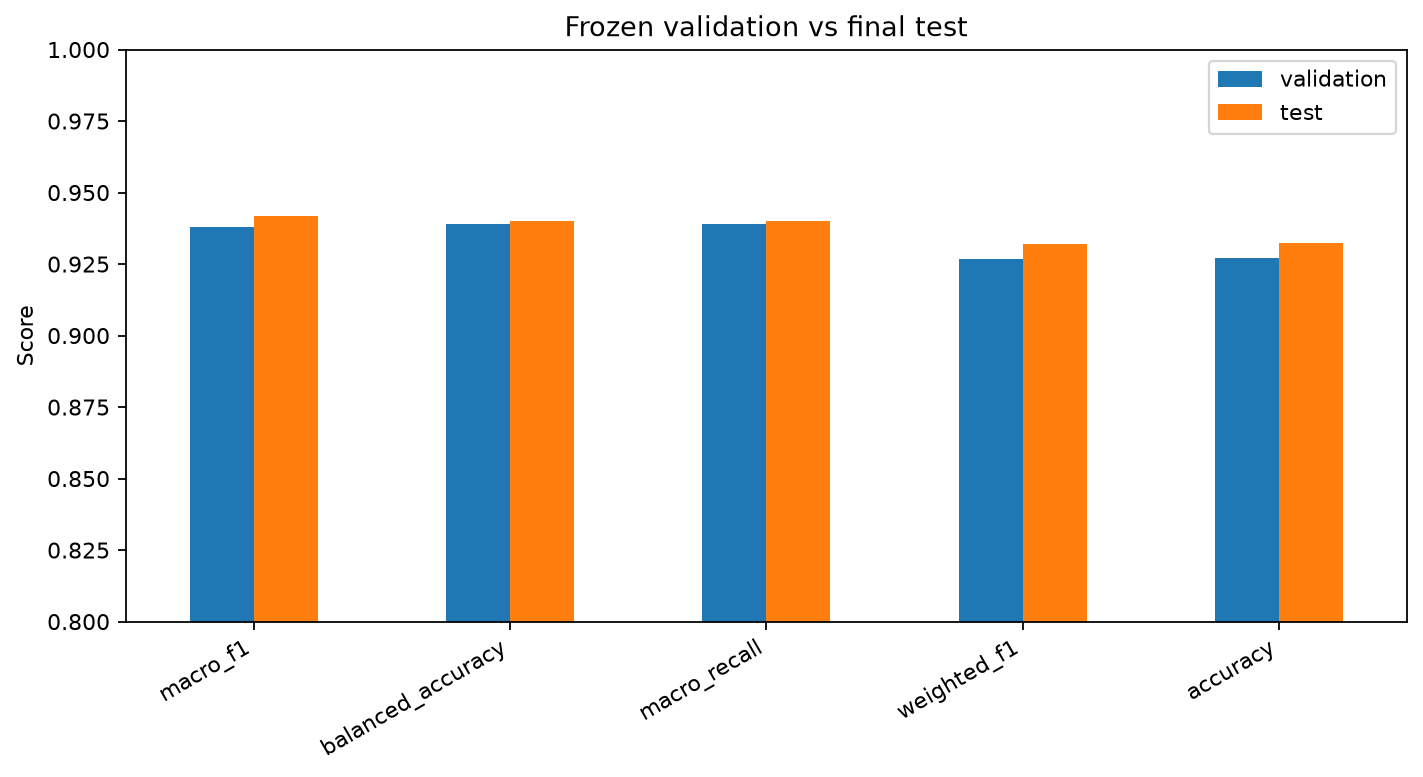
Macro F1 changes by approximately +0.003954 from validation to final test, while Balanced Accuracy changes by approximately +0.000766. These differences are descriptive generalization evidence and are not additional model-selection gates.
The final-test confusion matrix provides a more detailed view of the remaining classification errors.
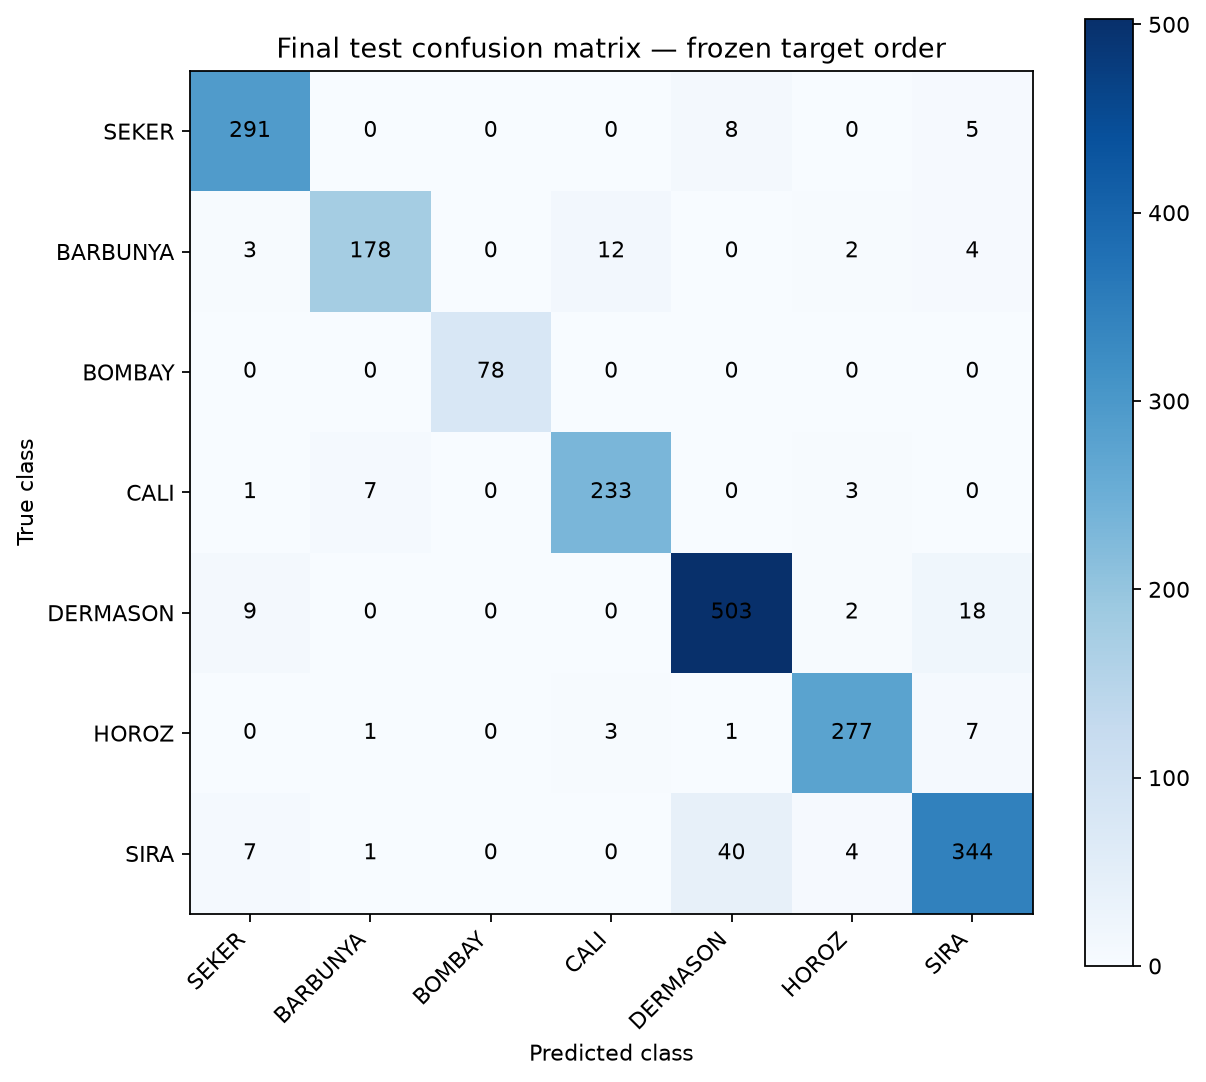
Most predictions are concentrated on the diagonal.
The largest mutual confusion is:
DERMASON ↔ SIRA — 58 errors
followed by:
BARBUNYA ↔ CALI — 19 errors
SIRA has the lowest final-test recall at approximately 0.8687.
Because this is a seven-class problem, there is no positive class or binary decision threshold. Prediction uses argmax: the class receiving the highest predicted probability is returned.
04 — Key Takeaways & Limitations
The study shows that numerical measurements describing bean size and shape contain strong predictive information for distinguishing the seven varieties within this dataset and evaluation protocol.
The model comparison also shows why the scientific conclusion should not be reduced to the claim that one feature configuration clearly dominated every alternative. The two strongest HistGradientBoosting configurations fall inside the predefined practical-tie tolerance, with Balanced Accuracy resolving the tie in favor of the complete 16-feature representation.
Validation and final-test performance remain similar, while the confusion analysis shows that residual errors are concentrated more strongly among some morphologically overlapping varieties rather than being distributed uniformly.
An important limitation concerns the history of the final-test partition.
In the corrected canonical execution, the test partition does not participate in target-aware exploratory analysis, cross-validation, hyperparameter search, feature-policy design or model selection. However, the same seed-42 test partition had already been evaluated once by a superseded earlier execution whose distribution-aware and target-aware exploration used the complete source dataset.
The corrected study re-derived its development decisions using training-only exploratory evidence without changing the predefined split, candidate space, metrics, seeds or tie rules. The corrected execution reproduced the earlier numerical results.
Nevertheless, the final-test partition cannot be described as a holdout that had never previously been opened.
The source also contains repeated feature profiles. Fifteen final-test observations have complete feature profiles also observed in train + validation. Excluding those observations changes Macro F1 only from 0.941835 to 0.941523, but feature-profile equality cannot establish that the records correspond to the same physical grain because the source provides no observation identifier.
The evaluation uses a stratified random snapshot rather than temporal, prospective or external validation. External representativeness has not been established.
The study evaluates numerical measurements that have already been extracted from images. It does not evaluate the complete upstream image-acquisition, segmentation or measurement process.
The source-formula provenance of ShapeFactor2 remains unresolved at the configured numerical tolerance. Its predictive sensitivity is explicitly evaluated, but retaining the feature does not resolve or invent its source provenance.
The study also does not establish causal morphology-to-variety relationships, universal probability calibration, equivalent performance under different populations or acquisition systems, future distribution stability, or production readiness.
Within those boundaries, the scientific conclusion is clear: a HistGradientBoostingClassifier using all 16 numerical morphology features provides strong multiclass predictive performance on the Dry Bean dataset, reaching a final-test Macro F1 of approximately 0.9418 and Balanced Accuracy of approximately 0.9399.
This portfolio post presents the main scientific findings. The study repository contains the complete notebooks, source and environment contracts, model-selection evidence, additional figures, reproducibility artifacts and detailed methodology.
Atlas DataFlow maintains scientific-reproduction evidence separately from its own Atlas-native training and release lineage. This preserves the distinction between the original scientific-study results, their independent reproduction and evaluations performed under Atlas-owned contracts.